


Quantifying the Streakiness of Batters
Understanding the Variability in a Batter’s Performance Over the Course of a Season


“It’s the month of Escobar!” Gary Cohen exclaimed as Eduardo was mobbed by his teammates near first base. On September 28, 2022, Eduardo Escobar went 3-5 with 5 RBI, including the game winner in the bottom of the tenth to send the Mets to the top of the NL East alone.
And Cohen was right. In September 2022, Escobar slashed a scalding .321/.358/.596, good for a .435 wOBA. His torrid September came off a terrible August in which he posted 8 total bases in 14 games. Here’s how those months fit into the rest of the season for him:

This was the Escobar the Mets signed. “He’s a streaky hitter”, everybody said. That’s how he runs. Hot and cold. Stop and start. But how do you quantify this? Just how streaky is Eduardo Escobar compared to the rest of the league? Surely every hitter goes through his ups and downs, so why is Eduardo so different?
I went on a quest to find out. To quantify Streakiness, I used Retrosheet game logs to look at how a player’s wOBA changed over the course of a season via 15-game rolling averages. There are a variety of ways by which I could have examined a player, but these are the parameters I chose to start off with.
wOBA (weighted on base average) is a stat which takes into account the manner by which a player reaches base, assigning different weights to singles, doubles, triples, home runs, walks (just unintentional) and HBPs individually. Those weights change each year to reflect the run-scoring environment. A double is more valuable than a single, a triple more valuable than a double, and so on. wOBA is also scaled to match OBP, so anything above 0.400 is great and below 0.300 not so much. An average wOBA is about 0.340. Tom Tango coined wOBA in The Book, and offers an in-depth explanation alongside it.
I like wOBA for this first pass, but I may also reproduce this analysis in the future with other Statcast-powered metrics like Barrel Rate to see how the expected stats stack up to the outcome-based ones.
To determine how ‘streaky’ a player is, I calculated their wOBA for each game of the 2022 regular season, and then calculated a 15 game rolling average. Each change (positive or negative) in wOBA counted toward a running total for the season, similar to calculating the excitement index of a football game. I then adjusted for the number of Plate Appearances each batter had, and found their Streakiness; in essence, the average number of points a player’s wOBA would change by per plate appearance.
Putting this into a graph, Eduardo Escobar’s 2022 season looked like this:
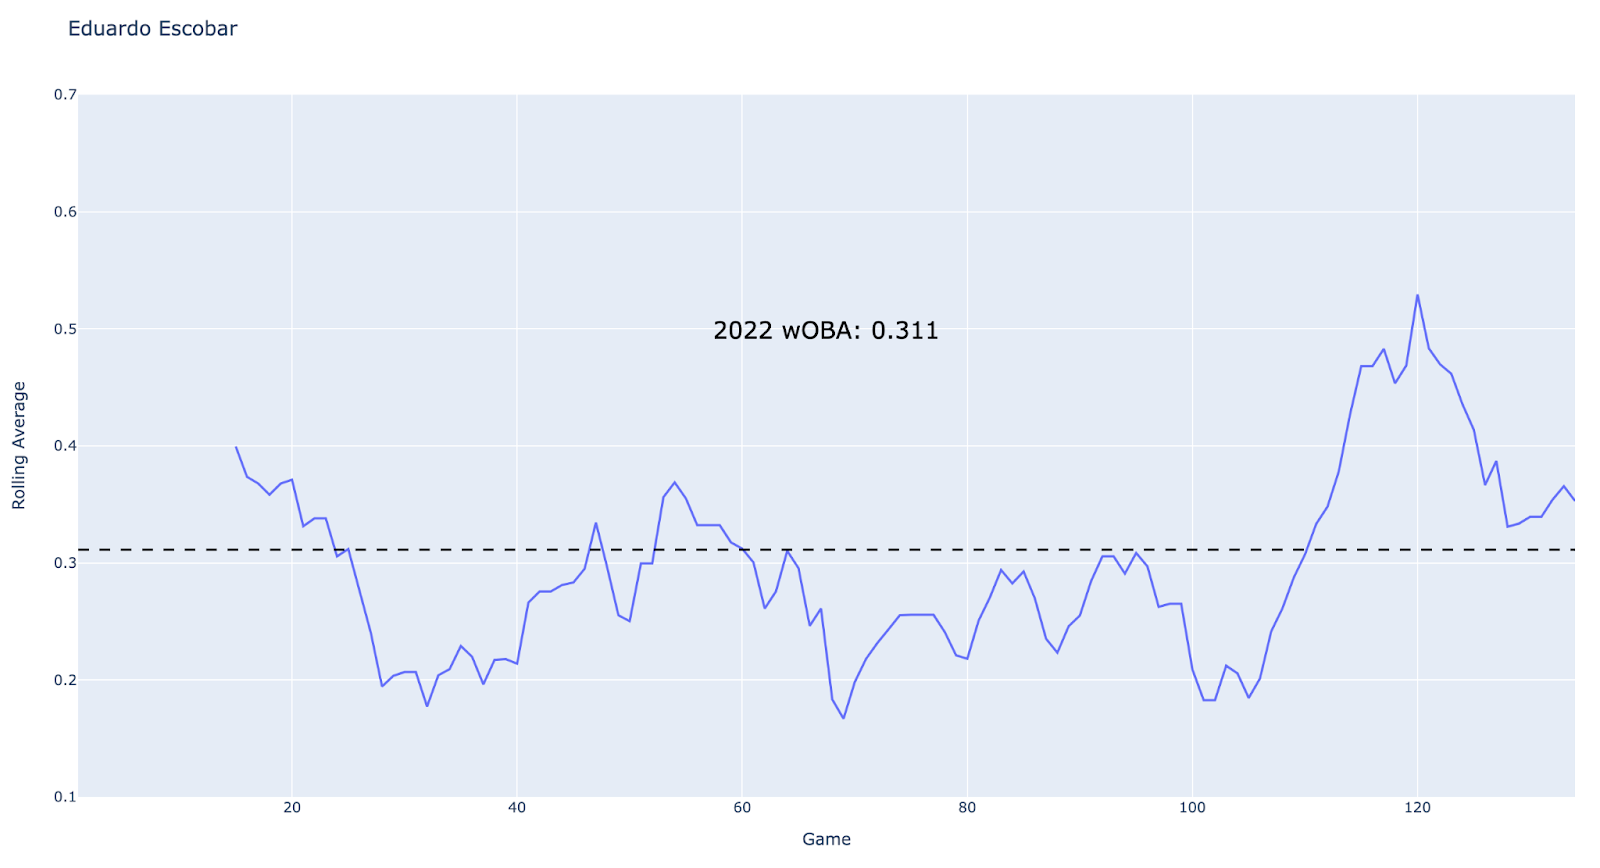
As you can see, Escobar played well above his 2022 rate for the final ~30 games of the season, reaching a peak on September 18, where his 15 game rolling wOBA reached 0.529. But where does this rank on the Mets? In the league?
According to Streakiness, the Mets’ streakiest hitter in 2022 was Pete Alonso, who ranked in the 92nd percentile among qualified hitters. His 2022 looked like this:

Compared to Escobar, Alonso seems to have fewer prolonged ‘streaks’ and a higher game-to-game fluctuation. In future versions of this score, I intend to account for such discrepancies by looking at various horizons besides a 15-game rolling score. Understanding the predictive power of one game’s wOBA to the next would also inform the degree to which batters enter longer funks or shorter bursts of variable production. There’s also room for time series analysis here, which I’ll integrate into the next version of this stat.
Escobar was the Mets next-streakiest hitter, but only clocked in at the 65th percentile. Let’s take a look at the league leaders.
Aaron Judge, who led the majors in all sorts of niche stats in 2022, also was MLB’s streakiest qualified hitter, or at least the one who saw the most variation in wOBA across the season.

Judge’s torrid second half meant that his 15-game average wOBA ranged from 0.249 to 0.665 across a period of a few months, helping him accumulate more raw change than any other hitter, even once prorated for his 698 plate appearances.
Seth Brown of the Oakland A’s was also particularly streaky (99th percentile), showing consistent variation around a middling season wOBA of 0.323:

The most consistent hitter in the majors last year was the Nationals’ Cesar Hernandez, who, across 617 plate appearances, was steadily well below average:

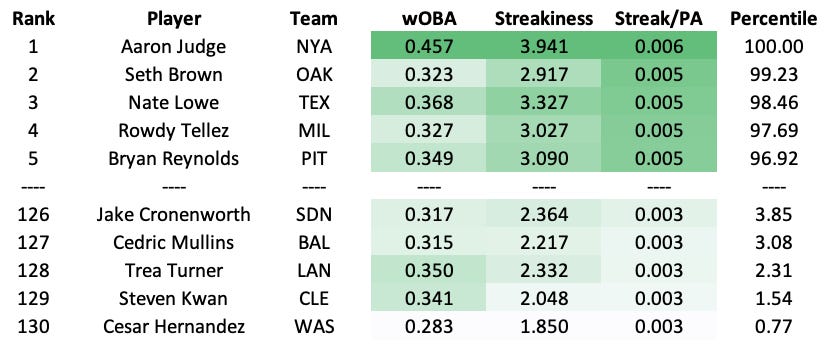
Here’s the top 5 and bottom 5 qualified hitters in 2022 in terms of Streakiness:
Having identified the streakiest and least streaky hitters, I was also curious to see if the league as a whole had any hot or cold streaks. Here’s what the 15 day rolling average league wOBA looked like for 2022:

If you really zoom in (note y axis), then you can see a slight increase in the warmer months, but the difference is relatively minor.

Here’s what the break-down by team across the season looked like:

That’s a lot, so let’s zoom in and take a look at a team comparison as an example. Here’s the Mets and the Braves getting hot at different times:

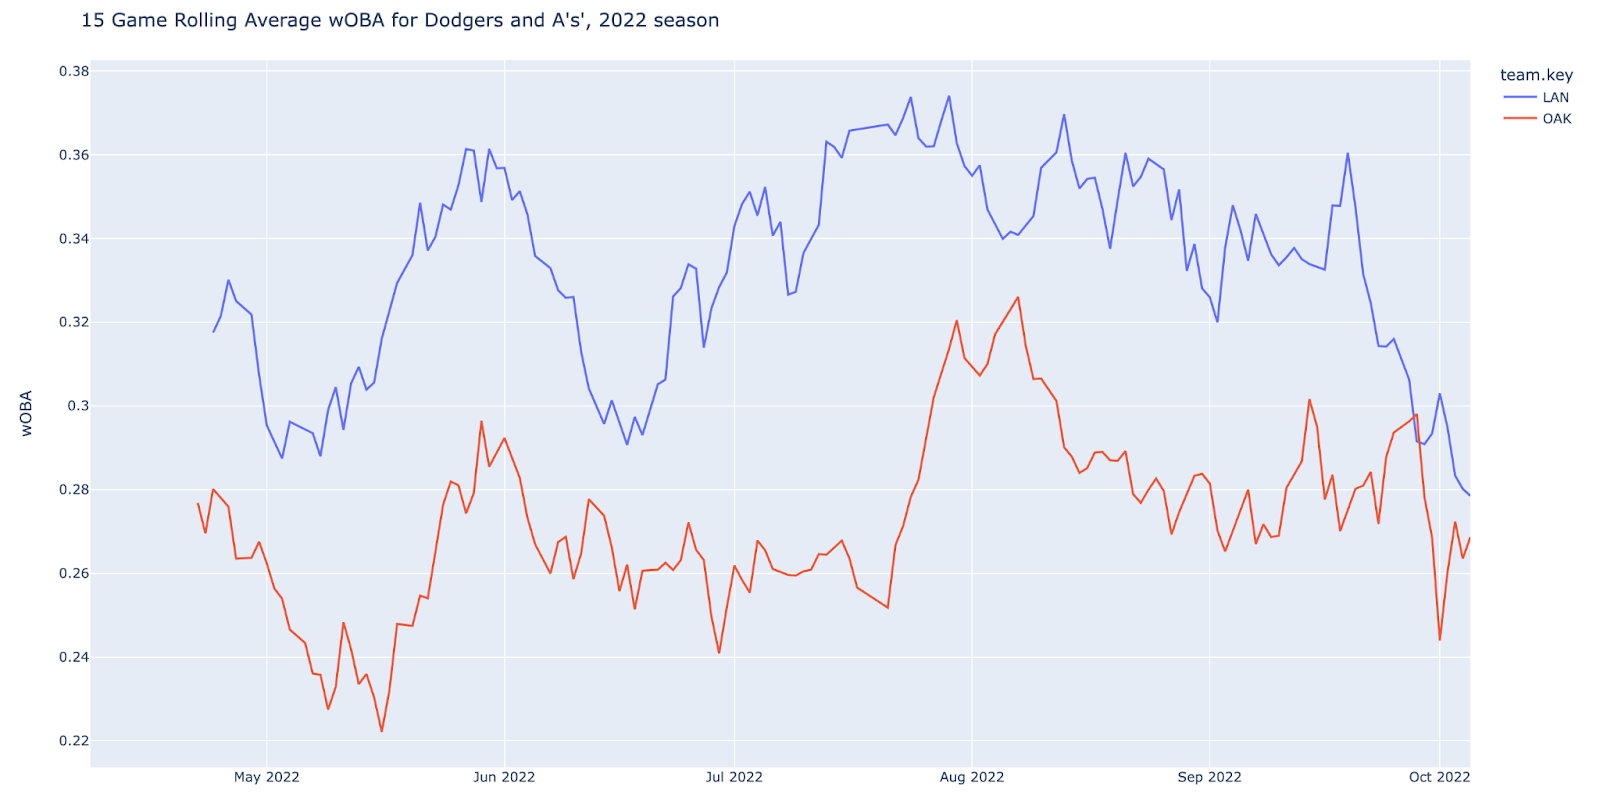
And here’s the league’s best team by wOBA (Dodgers, 0.337) vs. the worst (A’s, 0.277). Only at one point (September 28) do the A’s have a better 15-game wOBA than the Dodgers. For the entire rest of the season, the 111-win Dodgers trounce the 60-win A’s:
The most pressing question here is how much of this is Random Variation. I would assume a lot, so I’ll be looking at year-to-year wOBA changes to see just how sticky Streakiness actually is. Is there any predictive power in consistency? Is it an indicator of what’s to come?
For now, having quantified the Streakiness of players, teams, and the league as a whole, I am left with more questions and potential explorations than when I began. I’d like to know:
Do players become more or less consistent as they age?
Are certain ‘types’ of hitters streakier than others? In other words, do sluggers tend to enter and exit slumps at a greater pace than contact hitters?
How can I quantify the length of a slump or hot streak?
Are there any metrics I can use to predict when a player will enter a slump or hot streak?
I’d also like to apply this analysis to real-time data for the 2023 season to determine who is currently in a slump or hot streak. A next step would also be to apply this analysis to pitchers on a start-by-start basis, or for relievers to see if their outings are mostly random.
I’d also love to hear if there’s anything I can improve on for the foundational pieces. Should I use other stats in addition to, or in place of, wOBA? Extend or shrink the number of games used for a rolling average?
Thanks for reading. There are a ton of different paths that I could take this project down, so be on the look-out for more posts coming soon.
Works Cited:
Tango, T. Weighted On Base Average or wOBA, Woba - weighted on base average. Available at: http://www.insidethebook.com/woba.shtml (Accessed: 27 June 2023).
Benz, L. Yale University, Game Excitement Index Part II | Yale Undergraduate Sports Analytics Group. Available at: https://sports.sites.yale.edu/game-excitement-index-part-ii (Accessed: 27 June 2023).
Harrison, W. Is every run random? investigating momentum and streaky scoring in NBA basketball, Title. Available at: https://www.walker-harrison.com/posts/game_of_runs/ (Accessed: 27 June 2023).